Read the auction. Respect the Throne. Trade with a name. • LUCK = Learning Under Correct Knowledge. • Nile Continuation. Royal Fade. Return 2 Throne. Throne Bounce. • If you cannot classify the setup, leave it alone. •
Market Move 2 Freedom

Throne Toolkit Plus 7.2

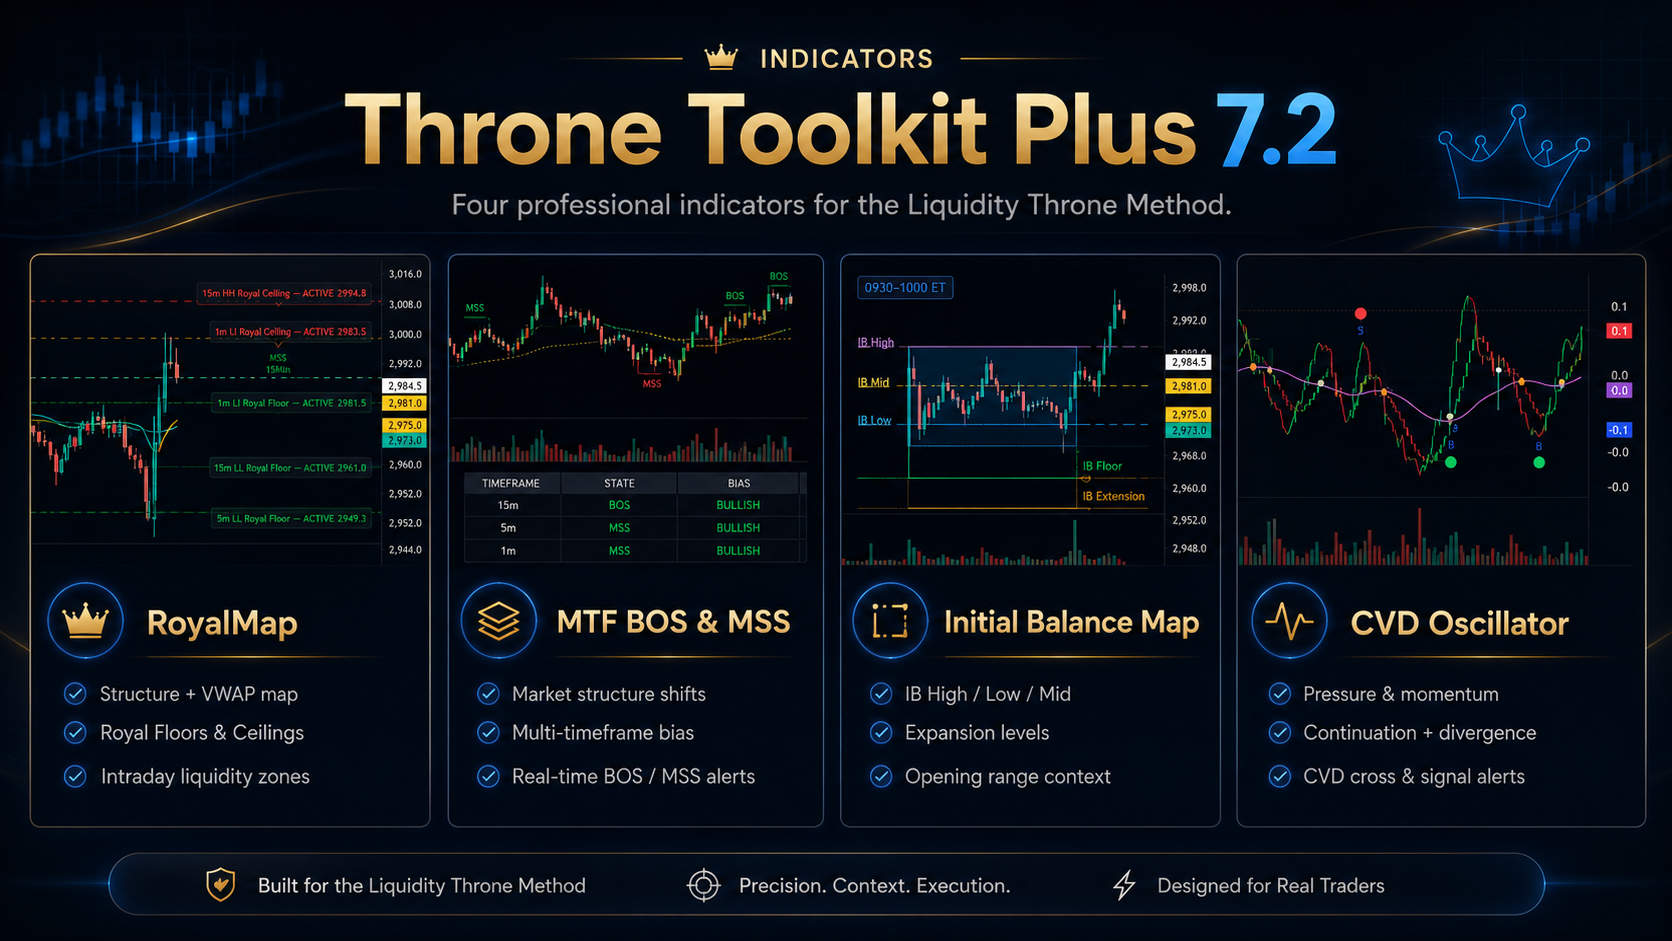
A four-indicator TradingView analysis suite built to organize market structure, VWAP location, Initial Balance behavior, and cumulative-delta pressure into one professional trading workflow.

RoyalMap MTF BOS & MSS Initial Balance Map CVD Oscillator

TradingView is the professional charting platform used with the Liquidity Throne Toolkit and MM2F Algo Engine. This is an affiliate link; Market Move 2 Freedom may receive compensation at no additional cost to you.

Market Move 2 Freedom — cinematic Matrix introduction
The complete chart view

Structure, location, pressure, and session context

The toolkit separates each analytical function into its own independent TradingView indicator. This keeps Inputs, Style settings, graphic objects, alerts, lines, labels, visibility, and pane behavior independent while the four modules operate together on the same chart.

Liquidity Throne Toolkit Plus 7.2 displayed on a one-minute Micro Gold Futures chart
Liquidity Throne Toolkit Plus 7.2 overview showing the four coordinated modules: RoyalMap, MTF BOS & MSS, Initial Balance Map, and the CVD Oscillator.
Four independent modules

One coordinated market-analysis suite

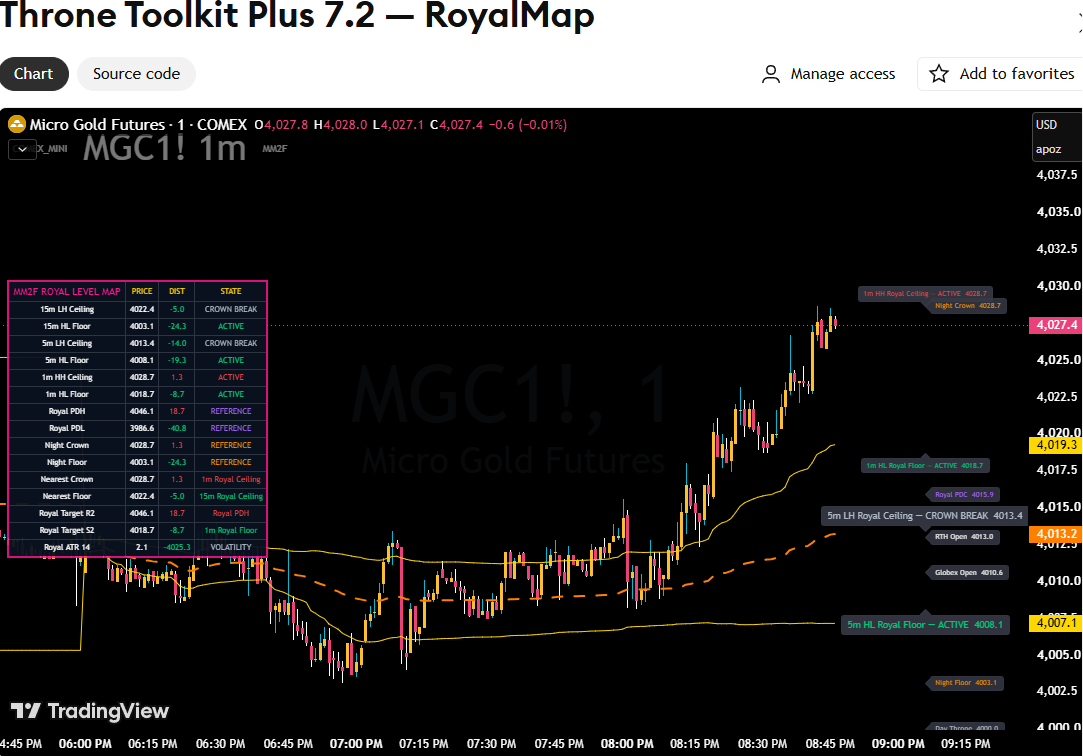
RoyalMap indicator displayed on a live Micro Gold Futures TradingView chart Actual TradingView screenshot — click to enlarge

1. RoyalMap

Multi-timeframe structure, session references, Throne location, volatility boundaries, and an actionable on-chart level panel.

  • 15-minute, 5-minute, and 1-minute structure
  • Royal Floors, Royal Ceilings, and Royal Zones
  • Globex Throne and RTH Throne
  • Previous-day, overnight, and session-open references
  • Optional ±1 standard-deviation boundaries
See the Toolkit
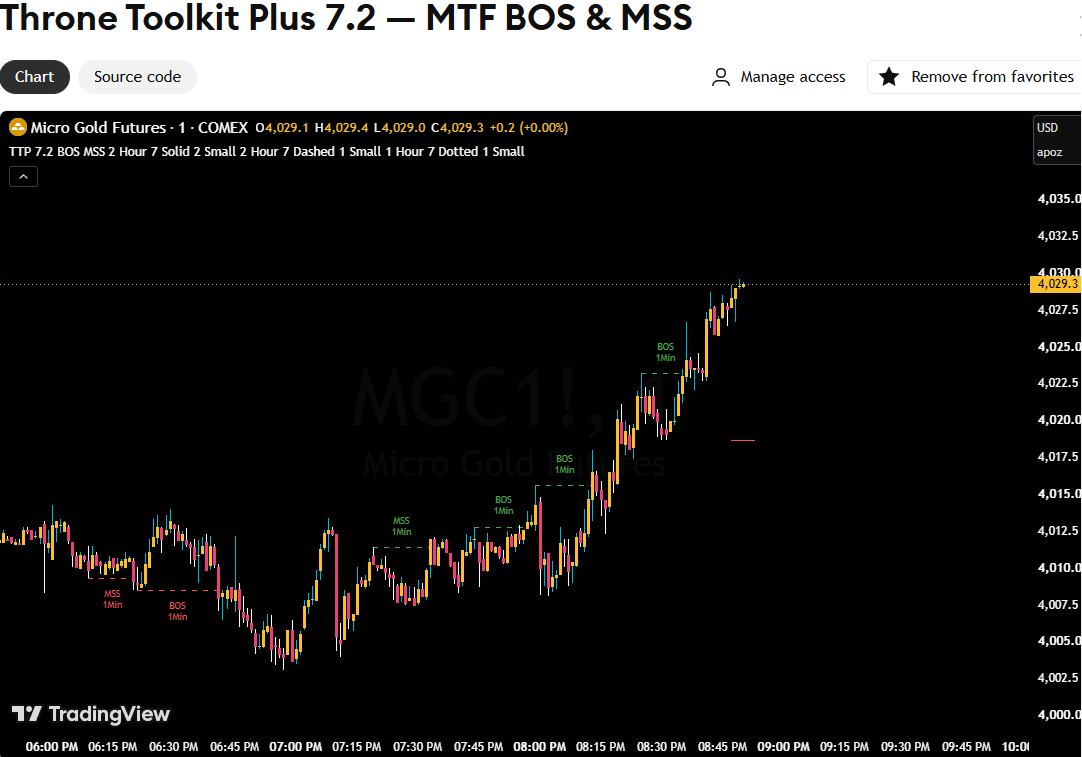
MTF BOS and MSS indicator displayed on a live Micro Gold Futures TradingView chart Actual TradingView screenshot — click to enlarge

2. MTF BOS & MSS

Three-timeframe Break of Structure and Market Structure Shift mapping for broader context and execution confirmation.

  • BOS and MSS detection
  • HH, HL, LH, and LL structure labels
  • Independent timeframe settings
  • Configurable line styles, widths, and colors
  • Independent BOS and MSS alerts
See the Toolkit
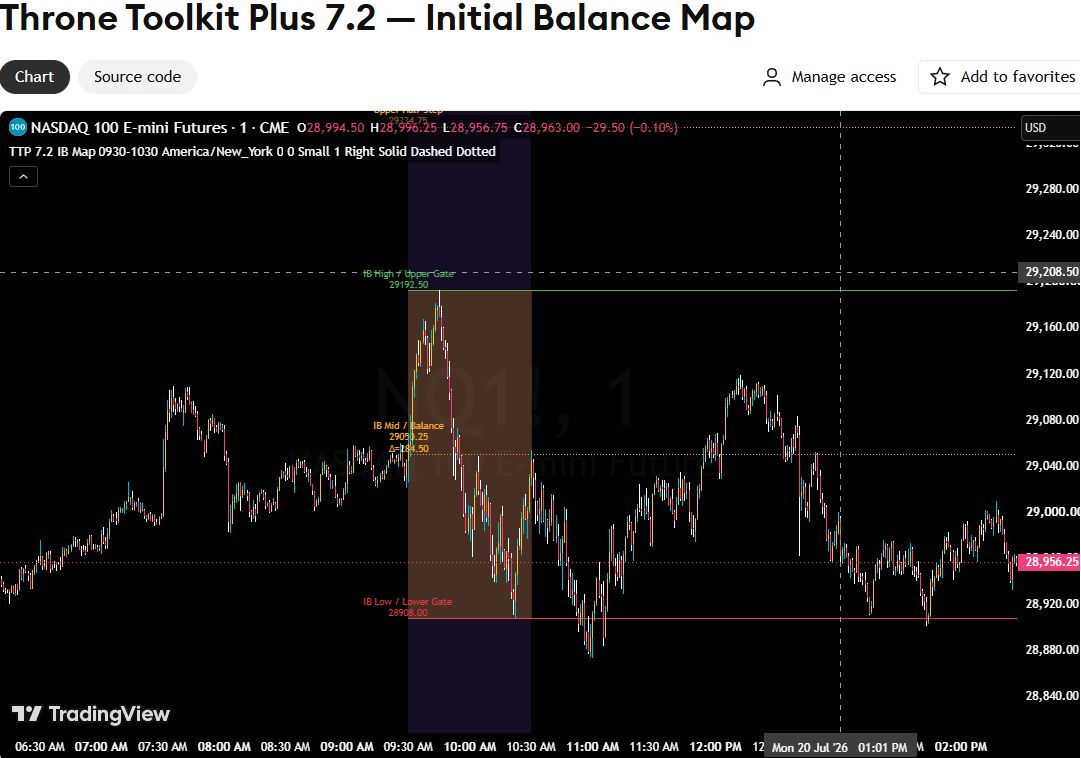
Initial Balance Map displayed on a live Nasdaq futures TradingView chart Actual TradingView screenshot — click to enlarge

3. Initial Balance Map

Opening-range structure and projected expansion levels for evaluating balance, acceptance, rejection, and range expansion.

  • IB High, IB Low, and IB Mid
  • Manual or market-aware sessions
  • Optional half-step, x2, and x3 levels
  • Latest-session line and zone controls
  • Liquidity Throne naming option
See the Toolkit
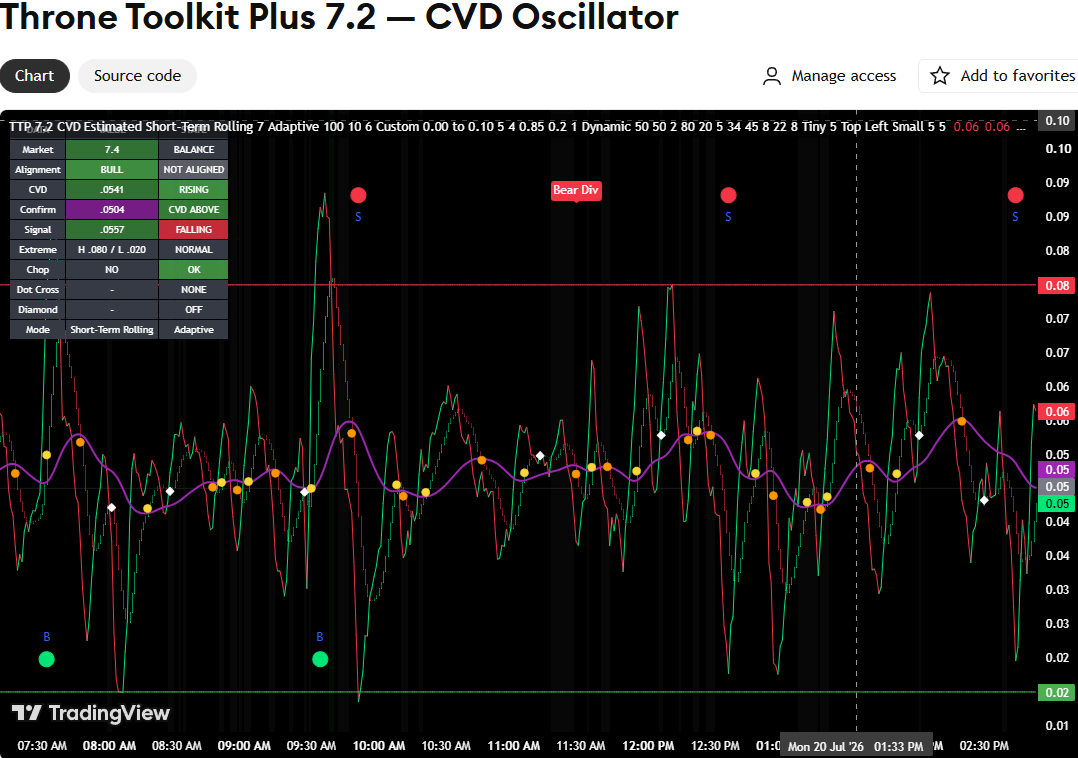
CVD Oscillator displayed in TradingView with state grid, signal line, dots, diamonds, and divergence markers Actual TradingView screenshot — click to enlarge

4. CVD Oscillator

A normalized cumulative-volume-delta style oscillator for pressure, alignment, continuation, divergence, and momentum-state analysis.

  • Smoothed CVD candle wave
  • Signal and dynamic confirmation lines
  • Yellow/orange confirmation-cross dots
  • White Diamond continuation markers
  • State grid, divergence, Edge Engine, and alerts
See the Toolkit
Liquidity Throne Method workflow

Read the market in five stages

01 ContextClassify trend, range, structure, and higher-timeframe direction.
02 LocationMeasure price against the Throne, SD boundaries, session levels, and Royal structure.
03 SetupIdentify Throne Bounce, Return 2 Throne, Nile Continuation, Royal Fade, or IB behavior.
04 ConfirmationUse lower-timeframe BOS/MSS and CVD alignment to confirm or reject the idea.
05 ExecutionDefine entry, invalidation, stop, targets, and management before taking risk.
ThroneVWAP only
Royal CeilingResistance or structural swing high
Royal FloorSupport or structural swing low
Crown BreakBullish break of structure
Royal BreakdownBearish break of structure
Night Crown / FloorOvernight high and overnight low
High-quality rule: Direction alone is not a trade. Extended price, conflicting structure, low-quality location, and poor reward-to-risk should be treated as WAIT / NO TRADE.
Risk disclosure

Educational and informational use only

Liquidity Throne Toolkit Plus 7.2 is not financial advice, investment advice, a recommendation, or a guarantee of trading results. Futures, stocks, options, forex, cryptocurrencies, and leveraged products involve substantial risk. Signals, levels, projections, structure labels, CVD measurements, and market-state classifications may be false, delayed, or incomplete.

The TradingView CVD module estimates delta from available OHLCV data unless a direct bid-and-ask volume source is available. It is not identical to exchange-level order-flow CVD calculated from true bid and ask transactions.

Every user is responsible for independent analysis, position sizing, risk controls, broker and exchange requirements, and compliance with all applicable rules.

Explore the Complete Toolkit

Put the Full Liquidity Throne Toolkit on Your TradingView Charts.

Get RoyalMap, MTF BOS & MSS, Initial Balance Map, and the CVD Oscillator together as one coordinated professional toolkit.

TradingView is required to use the indicators. The TradingView button is an affiliate link, which may provide compensation to Market Move 2 Freedom at no additional cost to you.

Liquidity Throne Toolkit Plus 7.2 Four coordinated TradingView indicators
See the Toolkit